Design an Infographic in Google Drawings
Summarize and communicate information visually by creating an infographic in Google Drawings.
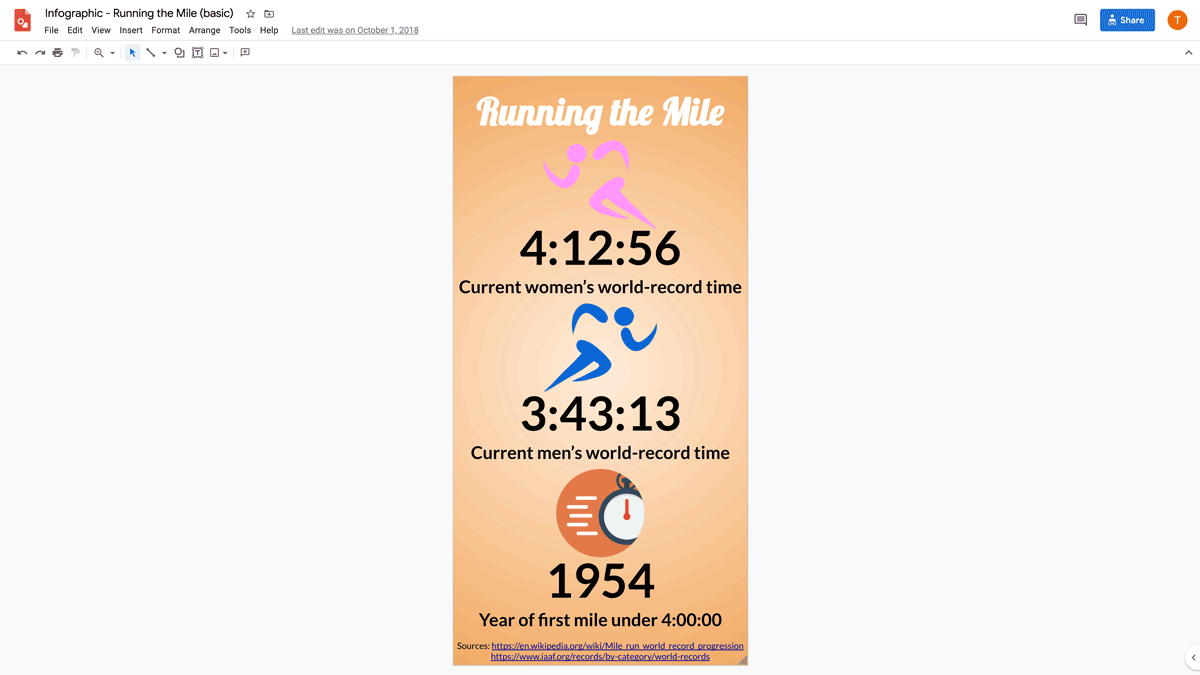
Example outcome
Lesson details
Learning objectives
By the end of this lesson, students should be able to:- Research a topic and find reliable data
- Understand how infographics can communicate data
- Design an infographic in Google Drawings to represent data visually
Time to complete
Audience
Digital tools
 Drawings
 Search
Skills


