Applied Digital Skills lessons have moved to a new platform! This site will no longer be available after June 30, 2025 and all accounts and data will be deleted. Learn more

This lesson will no longer be available after Jun 30, 2025.

Create a Book Character Map

Illustrate the relationships between characters in a story by creating a visual map in Google Drawings.
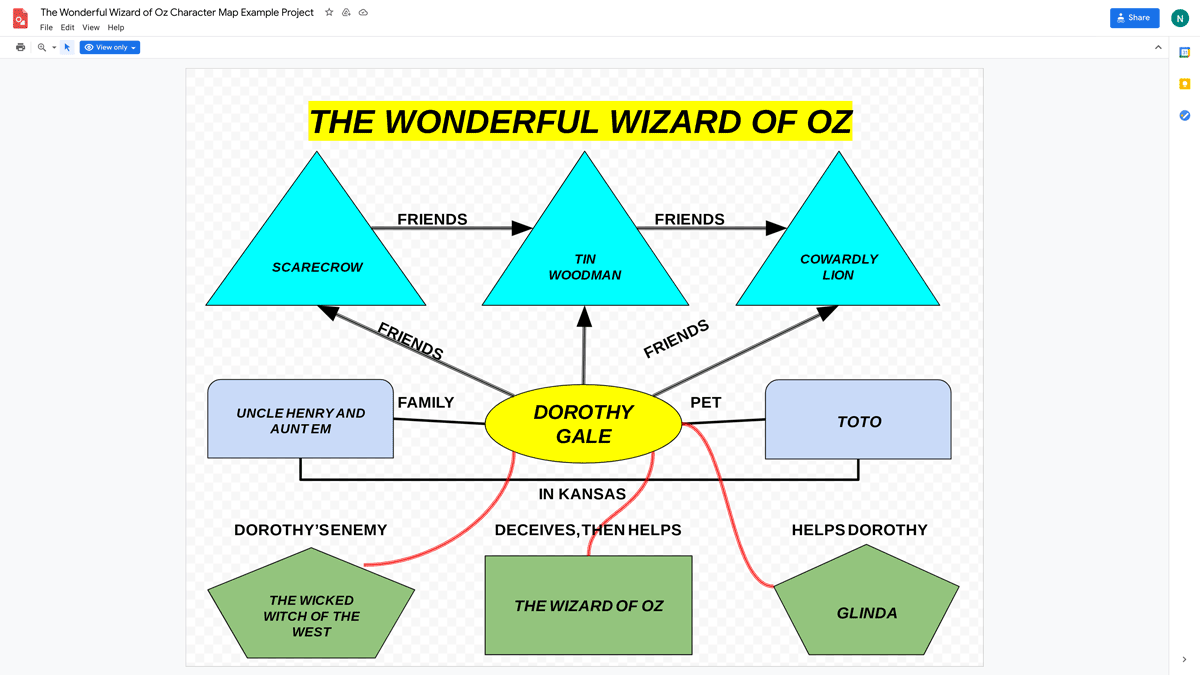
Example outcome

Lesson details

Learning objectives

By the end of this lesson, students should be able to:
  • Visually represent relationships in a story
  • Organize the components of the drawing in a way that represents relationships clearly

Time to complete

45—90 minutes

Audience

  • High School
  • Middle School

Digital tools

  • Icon representing the Drawings toolDrawings

Skills

  • Communication
  • Data visualization
  • Organizing data
namespaces/google.engedu.apski/contents/Unit-70297762801862792421849737231215379664en