Google Workspace: Slides - Part 3
Learn how to add tables, diagrams, and charts, and share your presentation.
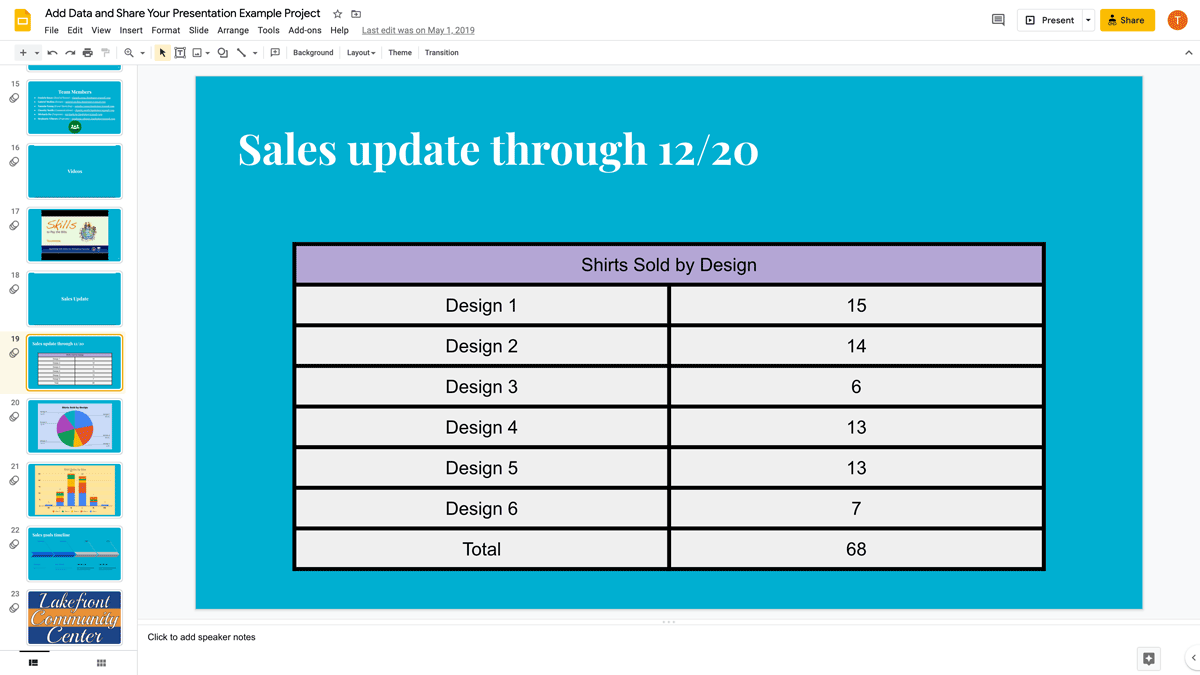
Example outcome
Lesson details
Learning objectives
By the end of this lesson, students should be able to:- Organize data in Google Slides using visual tools like charts, diagrams, and tables
- Communicate their ideas in digital form and hard copy by sharing their presentation
Time to complete
Audience
Digital tools
 Slides
Skills


